What you’ll learn:
- Dynamic power consumption simulation across a range of stimulus representing real-world conditions and workloads is exploding.
- “What-if” power exploration with numerous manual steps is difficult in the full-chip context that includes a mix of processors, bus activity, and peripherals using current power-analysis tools.
- A new power-modeling approach will eliminate the SoC power simulation gap and reduce computation time so that all full-chip SoC stimulus scenarios can be used to ensure a design’s power coverage.
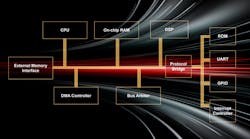
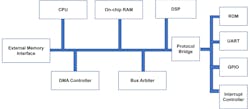
Low power is now a fundamental performance metric in system-on-chip (SoC) design. Nanometer-scale SoC design complexity—a mix of processor cores, memories, buses, and peripherals with a software stack controlling its operation—runs into tens or even hundreds of millions of logic gates, making power simulation and analysis a daunting task (Fig. 1). The result is slow full-chip power simulations.
An SoC’s power consumption can change in nanoseconds depending on software activity and hardware workloads. That means using design rules, performance of prior generation designs, and methods to estimate power consumption will not give a design’s real power footprint. Power hot spots affect reliability, and the choice of chip package can cause catastrophic failure through thermal runaway. A more precise analysis is essential to ensure correct operation and understand a design’s real power constraints.
The need to simulate and control dynamic power consumption across a range of stimulus representing real-world conditions and workloads is exploding, along with resources in the SoC deployed to complete a workload task. Tasks and their associated power footprints are managed through hardware or software supervision, control of the number of processors and process threads, and through dynamic changes in voltage, frequency, and bus activity. If a task can be completed using additional clock cycles with fewer hardware resources, then peak power consumption is reduced (Fig. 2).
Challenges with Today’s Power-Analysis Tools
Current power-analysis solutions are focused on the logic gate level and can’t provide the throughput to realize comprehensive power visibility at the software level in an SoC. Even hardware emulation can’t adequately simulate power consumption for a complete workload task that spans microseconds or milliseconds.
SoC designers have a suite of gate-level and RTL power-analysis tools available for determining power consumption at the block or unit level. Gate-level tools offer sign-off precision while RTL tools provide faster throughput with an accuracy loss that can exceed 10%. For a full-chip SoC simulation, millions or billions of nodes are analyzed for cycle-accurate dynamic power behavior.
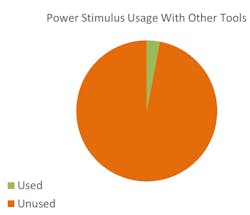
RTL tools can’t process a full SoC stimulus set without days of runtime (Table 1). Due to the lack of speed, engineers typically use only 2% to 3% of the total available stimulus for power analysis (Fig. 3). Hardware emulation can only process a portion of a stimulus workload; it’s not a general-purpose solution.
Instead of running the full SoC stimulus available, designers are forced to pick and choose where and when to simulate. This is risky since incomplete power verification inevitably invites chip failures, respin, and late software workarounds that can compromise performance and delay the final tapeout.
Another cause of power-analysis delays is identifying root causes of power consumption in the SoC. At the block level, various functions or tasks might be responsible for increased power consumption. At the full chip/SoC level, different design blocks can interact to produce power-density peaks. With the tools currently available, power reports don’t estimate power consumption of the functions/tasks or features, which then necessitates lengthy debug and analysis of active signal waveforms.
The process of getting power reports, then performing the waveform analysis to identify root causes, can have multiple iterations, increasing the delay in analysis.
What-If
Early “what-if” power analysis is another area that needs attention in every SoC design before making major architecture and design choices. For example, a design architect needs to get early visibility into power consumption by simulating varying transaction density, the effect of increased cache misses, increasing bus throughput for power vs. performance analysis, or changes in voltage and frequency.
“What-if” analysis is an essential step in improving and optimizing a design’s power footprint. Consider the following scenario where peak dynamic power reduction at the full-chip level is achieved by stretching the time to complete a task. This is a classical tradeoff that designers perform to understand where power savings can be achieved, improving battery life and reliability, and reducing packaging and cooling costs.
Current power-analysis solutions require numerous manual steps to accomplish many “what-if” power exploration efforts. For example, if the “what-if” power exploration scenario stretches out the time required to complete certain tasks to reduce instantaneous power peaks, and the time spent analyzing power peaks in a GPU (Table 2). It further adds time spent modifying the RTL code and re-simulating in a loop that can have many iterations.
Given the large number and duration of SoC stimuli, “what-if” analysis is difficult at an SoC’s block or unit level. It’s almost impossible with the current power solutions in the full-chip context with a mix of processors, bus activity, and peripherals.
Some SoC designers have taken time to build custom script-ware to do different “what-if” scenarios, explore changes in software activity and hardware resource allocation, and then collect the relevant data and display the desired metrics. These home-grown solutions require effort to build and maintain, are design-specific, and take days of runtime to get results.
A new power modeling approach is needed to eliminate the SoC power simulation gap and reduce computation time so all full-chip SoC stimulus scenarios can be used to ensure a design’s power coverage is 100% and not 2% to 3%. This modeling approach must have precise correlation with results from power sign-off tools.
A tool that shows the root cause of a power issue early in the design flow and highlights those actions contributing to a power hot spot vs. changes in software activity and hardware loads is imperative.


