This article is part of the TechXchanges: Trace Debugging Techniques and Developing High-Quality Software
Members can download this article in PDF format.
What you’ll learn:
- Modern trace and debugging techniques.
- IDEs to use for trace and debugging.
In computer programming and software development, engineers will deploy debugging tools and processes to find and mitigate "bugs" or problems within programs, applications, and systems. The word "debugging" was derived in the 1940s when a Mark II computer (Aiken Relay Calculator) malfunctioned, and engineers subsequently found a moth stuck in a relay, impeding normal operation.
All kinds of techniques and tools allow engineers to root out problems within a software environment. As software and electronic systems have become more complex, the various debugging techniques have broadened with more methods to detect anomalies, assess impact, and provide software patches or complete system updates.
Debugging ranges in complexity from fixing simple errors to performing lengthy and extensive tasks, including data collection, analysis, and scheduling updates. The difficulty of software debugging varies depending on the complexity of the system and, to some extent, on the programming language used and the available tools.
Software tools enable the programmer to monitor the execution of a program, stop it, restart it, set breakpoints, and change values in memory, among others. Much of the debugging process is done in real-time by monitoring the code flow during execution, more so during the development process before application deployment.
What is Tracing?
One technique that monitors software in real-time debugging is known as "tracing," which involves a specialized use of logging to record information about a program's execution. Programmers typically use this information to diagnose common problems with software and applications. Tracing is a cross-cutting concern, meaning it involves aspects of a program that can affect other parts of the same system and, in turn, provides detailed information of the program as it's executed.
With debug and trace, programmers are able to monitor the application for errors and exceptions without the need for an integrated development environment (IDE). In debug mode, a compiler inserts debugging code inside the executable. Because the debugging code is part of the executable, it runs on the same thread as the code. As a result, it doesn’t provide the same efficiency of the code.
Trace works in both debug and logging mode, recording events as they occur in real-time. The main advantage of using trace over debugging is to do a performance analysis, which can't be accomplished on the debugging end.
What's more, trace runs on a different thread. Thus, it doesn’t impact the main code thread. When used in tandem, tracing and debugging can provide information on program execution and root out errors in the code as they happen.
Trace Techniques
It should be noted that tracing and logging are two separate entities; they provide overviews of software execution, with each functioning differently (Fig. 1). Logging tracks error reporting and related data in a centralized way, showing discrete events within an application or system, such as failures, errors, corruption, and states of transformation.
On the other hand, tracing follows a program's flow and data progression, providing more information over a larger spectrum of the app stack. Tracing lets users see when and how the error occurred, including which function is at fault, duration, parameters, and how deep the function goes.
To that end, various techniques and applications can carry out that function. These techniques depend on the ability to collect information about the system under study. Data-collection techniques can be grouped into two categories: static analysis and dynamic analysis.
Static analysis uses the source code to uncover the system's components and relationships. Performing static analysis has the benefit of covering all of the program's execution paths. However, it’s only able to reveal the static aspects of the system, and it's limited in providing insights into the behavioral characteristics of the program. This insight can be critical for analyzing distributed applications such as service-based systems due to the high level of interactions involved.
Dynamic analysis is the study of how the system behaves by analyzing its execution traces. Unlike static analysis, dynamic allows users to focus only on parts of the program that need to be analyzed, which is accomplished by analyzing the interactions of the active components. Dynamic analysis also can be utilized for applications that require understanding the system's behavior by relating the system inputs to its outputs.
There are two types of dynamic analysis: online and offline. Online analyzes the behavior of an active system while it’s running. This type of dynamic analysis comes in handy when the system under analysis will not terminate its task over long periods. Offline analysis is different from the time when event traces are collected, meaning the event traces are collected during the execution of the system, while the analysis is usually performed upon completion of the execution.
This brings us to distributed tracing, which handles trace-based analysis in a cloud environment, microservices, container-based deliveries, etc. Distributed tracing follows an interaction by tagging it with a unique identifier and staying with the transaction as it interacts with those applications mentioned above.
The unique identifier provides real-time visibility as the application runs through its process. It offers insight into the flow of requests through that microservice environment and identifies where failures or performance issues occur within the system.
Applications
A wide variety of trace apps can provide in-depth insight into every software platform imaginable, with some being platform-specific for systems that utilize Android, Windows, and Linux, among a host of others. Below are several widely used trace applications that incorporate a variety of metrics and analytics for pinpointing bugs along the development chain.
Datadog APM
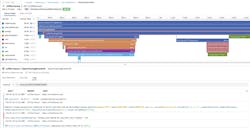
The Datadog APM is a cloud-based software performance monitor that packs many varieties of source data, including distributed-tracing messages (Fig 2). The platform can collect and process OpenTracing and OpenTelemetry messages, which are filed with other indicators to make insight a breeze. It also aggregates statistics on microservice performance and application processing environments with agents that can target specific telemetry insight.
Beyond monitoring standard distributed-tracing messages, the Datadog APM can interface with a range of AWS services, including the Lambda microservices platform. In addition, it generates visual representations that show the connections between microservices operating live in a hierarchy.
New Relic APM
The New Relic APM is targeted at developers and businesses that want to monitor their microservices infrastructure. The platform centralizes the data collected from various sources, including distributed-tracing messages garnered via OpenTelemetry, OpenTracing, OpenCensus, and Zipkin. It also can monitor other data sources, including application log files from infrastructure devices, along with a list of AWS services such as Lambda, Azure, Apache, and operating-system status reports.
As with Datadog, New Relic deploys its own agents to provide additional insight into web and app performance, driven by microservice actions, including browser monitors and connection testers.
Dynatrace
Dynatrace is an AI-driven platform that utilizes the cloud, applying machine-learning and heuristics to identify critical information from large amounts of data generated by reporting and logging systems. The Dynatrace system takes advantage of the OpenTrace standard and processes activities that contribute to a given application. It then tracks back by analyzing distributed-tracing messages to identify all of the microservices that worked on a given session for that application.
While the platform allows developers and system managers to write and test microservices efficiently, it also monitors application performance and will produce alerts if a problem is identified within that microservice.
Read more articles in the TechXchanges: Trace Debugging Techniques and Developing High-Quality Software


