Members can download this article in PDF format.
What you'll learn:
- What is time-of-flight mass spectrometry?
- How ToF MS has gained more interest since the commercialization of MALDI.
- Why a high-speed ADC is key to ToF MS performance.
- Mixed-signal front end that integrates RF ADCs among other advanced components.
Mass spectrometry (MS) is an analytical technique for quantifying known/unknown molecules within a sample based on molecular weight. By ionizing elements and/or molecules in the sample into gaseous ions with or without fragmentation, and then separating them in a mass analyzer, they are characterized by their mass-to-charge ratio (m/z), or location of the pulses, and relative abundance (or the amplitudes of the pulses) in the mass spectra.
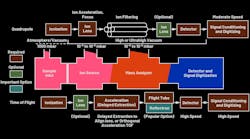
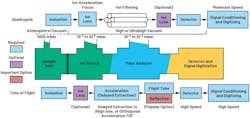
A mass spectrometer consists of three major components: the ion source for producing gaseous ions from the sample under test, the mass analyzer for separating ions according to their m/z ratios, and the ion detector for detecting the ions and the relative abundance of each ion species. The detector output is conditioned and digitized to produce a mass spectrum. Several mass analyzers with fundamentally different strategies for separating ions of different m/z values are available.1 Figure 1 shows major blocks of quadrupole and time-of-flight (ToF) MS.
In ToF MS, ions formed by a short ionization event are accelerated by an electrostatic field so that ions of different m/z have the same kinetic energy but different velocities. The ions then travel over a field-free drift path and arrive at the detector with different flight time—the lighter ions arrive before the heavier ones (Fig. 2).
In practice, the flight time of a pack of ions of the same m/z distributes to form a pulse that can be as narrow as a few hundred picoseconds due to differences in initial spatial distributions and energy (or velocity) in the acceleration region. Each pulse is the sum of signals corresponding to multiple independent ion arrival events and often is characterized by the full width at half-maximum (FWHM) parameter.
A detector, such as a microchannel-plate (MCP) detector, detects incoming ions and produces an electric current of pulses. The electric current is recorded with a time-to-digital converter (TDC) or a high-speed analog-to-digital converter (ADC).
While TDC can be extremely fast down to a few picoseconds, it has a limited dynamic range for registering the amplitude of the pulses. High-speed ADCs can achieve 2 or more gigasamples per second with 10-bit, 12-bit, or even higher bit resolution, allowing for precise registration of both timing and amplitude of the pulses. We’ll discuss important specifications of high-speed ADCs that impact the performance of the ToF MS.
Applications of Time-of-Flight Mass Spectrometry
ToF MS has gained quite a bit of interest since the 1990s, when the matrix-assisted laser desorption and ionization (MALDI) was invented and commercialized.2 The MALDI technology ionizes the matrix molecules, typically organic acids, and vaporizes the sample molecules at the same time with ultraviolet (UV) laser pulses from hundreds of picoseconds to a few nanoseconds.
In the gas phase, the matrix molecules transfer protons to the sample molecules so that the sample molecules are protonated and become charged ions. Because the matrix absorbs most of the laser energy, molecules in the sample retain their integrity without fragmenting or decomposing, making MALDI the most compelling ionization method for the analysis of biological macromolecules.
With easy coupling between MALDI and ToF MS, unlimited mass range, high sensitivity, and high throughput, ToF MS has become an essential tool for biomedical research, drug discovery, and clinical applications where analytes are often macromolecules.
Notably, MALDI ToF MS plays an irreplaceable role in clinical bacterial identification with its fastest turnaround time of four hours, compared to the 72+ hours by conventional or other novel technologies.3 Short turnaround time is critical to the care and outcome of patients suffering from bacterial infections.
Additional advantages of MALDI TOF MS include easy sample preparation, low operation cost, and the potential to identify some rare bacteria. With antimicrobial resistance posing a major threat to human health around the world, MALDI ToF MS is trending as a point-of-care device.4
Key Parameters of ToF MS
The ability of ToF MS to quantify the different analytes in the test samples depends on many factors, including choice of sample ionization method, configuration, and timing characteristics of electric fields for accelerating and guiding the ions toward the ion detector, detector efficiency, and signal digitization. We limit our discussion to key specifications of ToF MS that are related to signal digitization, including mass range, mass accuracy, mass resolution, repetition rate, and sensitivity.
The mass range is the range of molecular weight of molecules in the sample and is related to several factors, including accelerating voltage, flight tube length, sampling rate, and repetition rate. The mass-range requirement varies depending on the application. For instance, the bacterial identification by MALDI ToF MS measures ribosomal markers in the mass ranges of 2,000 to 20,000 daltons (Da).
Since mass is calculated from flight time, the mass accuracy of ToF MS is primarily determined by the accuracy of time measurement of the pulses. In practice, the arrival time of each pulse is calculated by fitting the pulse to a Gaussian function and finding the peak. The ADC sampling rate determines the number of samples for an individual pulse and is critical for fitting the pulse.
The mass resolution is a measure of the closest distinguishable separation between two neighboring pulses in the spectrum. It’s often defined as the ratio of the ion mass to the width of the corresponding mass pulse. A typical definition of the width of a pulse is the FWHM. The narrower the pulse, the higher the mass resolution, meaning a better differentiation between two ion packs with close molecular weights. While the mass resolution can be significantly improved by orthogonal acceleration and reflectron, the ADC sampling rate and noise performance also affect this key specification.
In ToF MS, the mass spectrum is the summation of signals from many repeats rather than a single transient that includes only a single process of ionization, acceleration and drifting, and ion detection and digitization. More importantly, for test samples with multiple molecules of different molecular weights and concentrations, a single ionization event may neither produce ions of all molecules of interest nor the ratios proportional to their concentration.
Summation is an efficient and practical approach to reduce such sampling error and improve the signal-to-noise ratio (SNR). Hence, the repetition rate is an important and practical specification of ToF MS for SNR and throughput. The latest ToF MS can achieve 1 kHz or faster scan, meaning each transient takes 1 ms or less. Increasing the ADC sampling rate shortens the duration of each transient for a faster repletion rate.
The sensitivity of ToF MS is the capability to detect the molecules with the lowest concentration in the samples. It’s collectively determined by many factors such as the chemical background noise, the range of concentrations of all molecules of interest, the noise figure and dynamic range of the detector and ADC, and the number of transients summed for the final mass spectrum. In practice, the system sensitivity can be optimized by identifying the bottleneck factor and/or balancing these factors.
Desired ADC Specifications for ToF MS
A low-noise, high-speed ADC is critical to the system performance of ToF MS. As previously discussed, the accuracy of time measurement and the system noise level are two important specifications of ToF MS instruments. While there’s a workaround for system noise level by summation of repetitive measurement, the accuracy of the time measurement is determined by the sampling rate and the aperture jitter of the high-speed ADC.
Considering the pulses can be as narrow as a few hundred picoseconds in a ToF MS instrument with orthogonal acceleration and reflectron, there are only a few samples for an individual pulse at a 5-Gsample/s rate. Every sample is crucial to find the peak of the pulse when the samples are fitted to a Gaussian function. Hence, sampling rate and aperture jitter are desirable ADC specifications.
The sensitivity is determined by the system noise level that can be improved by summation of repeated measurements. However, the number of repetitions limits the throughput of the instrument. The ADC’s noise performance is important for achieving targeted sensitivity with fewer repetitions.
There’s often a misperception pertaining to ADC performance in that its SNR is proportional to its bit resolution. ADCs with a sampling rate of 1 Gsample/s or above often use the pipelined architecture and have specifications including an effective number of bits (ENOB) and noise density/noise figure/SNR/etc.
However, pipelined ADCs can’t achieve the bit resolution since they suffer several disadvantages contributing to the noise. These include high-gain and large-bandwidth op amps required to reduce errors, capacitor mismatch, and the power dissipation of the front-end sample-and-hold (S/H) and op amps.5
The ENOB is input-frequency- and sampling-rate-dependent and calculated with signal-to-noise and distortion ratio (SNDR). For instance, the 12-bit AD9081 has an ENOB of 8 bits at 4 Gsamples/s with an input frequency of 4500 MHz. ENOB isn’t a good measure of the ADC noise performance. Noise density is a step closer to the practical noise level, but bench testing with Gaussian pulses holds the ground truth of the ADC’s noise performance of ADC and, therefore, the sensitivity of the ToF MS instrument.
Bench Test of a Low-Noise, High-Speed ADC
The mixed-signal front end (MxFE) offers smart integration of RF ADCs, digital-to-analog converters (DACs), on-chip digital signal processing, and clock/phase-locked loop (PLL) for multichip synchronization. MxFE parts with high-speed ADCs only are also available.
For simplification, our bench test used the AD9082, which has both ADCs and DACs integrated (Fig. 3). The integrated DAC was utilized to generate a narrow Gaussian pulse train with an FWHM of 0.5 ns and amplitude controlled by a combination of digital scaling and external attenuators. The Gaussian pulses are much closer to the signal in mass spectra than the typical single-tone signal for ADC characterization.
Two ADC channels are set up for the digitizing signal: CH1 for various amplitudes saturated or attenuated by varying the external attenuators, and CH2 as a reference for the signal strength above 90% full-scale (FS) without saturation. The sampling rate was 6 Gsamples/s in our test for sufficient samples for each pulse.
Three types of tests were performed:
- Attenuation and saturation tests: CH2 with fixed 7-dB attenuator pair as a reference; CH1 with 8-, 9-, and 10-dB attenuator pair for attenuation cases, and 3- and 1-dB attenuator pair for saturation cases.
- Weak signal measurement with up to 20-dB attenuation: CH2 connected directly to DAC output as a reference with –16-dBFSC scaling; CH1 with 10-dB attenuator pair for <32% FS signal and 20-dB attenuator pair for <10% FS.
- Noise measurement: CH2 with fixed 7-dB attenuator pair as reference; CH1 with 50-Ω termination.
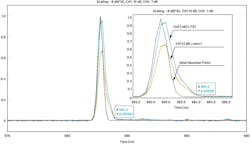
For each test, we acquired >10 µs data and repeated the data acquisition 10 times for a reproducibility check. We plotted and analyzed the data in MATLAB. The 10 repeats were aligned and plotted for each test case. Figure 4 shows a single pulse in the test, where CH1 is 3 dB lower than CH2. The 10 repeats were well overlapped for both channels, demonstrating high reproducibility of the data acquisition.
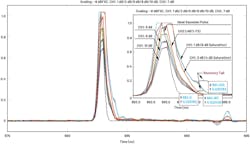
The AD9082 ADC has an overload protection circuit, which will be activated if the amplitude of the input is higher than the upper limit. There’s often a recovery tail at the falling phase of the pulse if the protection circuit is activated, resulting in a clipped peak at FS and a recovery tail. A shorter recovery tail is important for accurate time and hence mass measurement for the ToF MS.
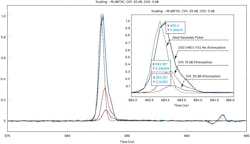
Figure 5 shows the plot of five cases with either saturation (up to 6 dB) or attenuation. There was a recovery tail of <0.4 ns for 6-dB saturation, suggesting minimal recovery widening when the protection circuit was activated.
To test ADC performance with weak input, we acquired the signal attenuated by 10 dB and 20 dB (Fig. 6). The clean trace of the signal was at 10% FS, or attenuated by 20 dB, suggesting minimal noise contributed by the ADC.
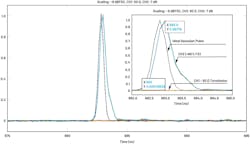
For the ADC noise floor, CH1 was connected using a 50-Ω terminator while CH2 remains at >90% FS (Fig. 7).
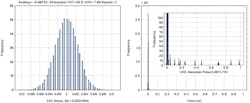
We analyzed the noise data by plotting the histogram and calculating its standard deviation (Fig. 8). The standard deviation of this case was at 0.0025, suggesting an SNR of 52 dB at FS.
To further quantify the accuracy of time measurement and noise performance, we segmented each pulse with the peak in the center of a 30-ns window. Each pulse was then fitted with a Gaussian model to measure its FWHM. We used 12-ns data on each side, or 24-ns total, of the 30-ns window as the baseline for noise calculation.
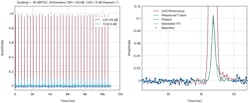
Figure 9 shows the plot of the complete acquisition for the test case of input at 10% FS and zoom-in of a single pulse with Gaussian fit and segmented baseline. Table 1 lists the mean and measured FWHM and calculated SNR.
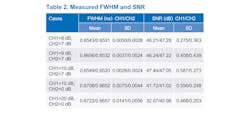
We measured the FWHM and SNR of all test cases with input attenuated from 1 to 20 dB. The results are summarized in Table 2. The results suggest accurate time measurement with consistent FWHM readout across various input amplitudes.
MALDI ToF MS Expected to Gain Popularity
With the establishment of MALDI ToF MS as standard care for bacterial identification in clinical microbiology laboratories and growing interest in proteomics for personalized medicine, the MALDI ToF MS is expected to continue its growth momentum in healthcare in the coming decades. There are also broad applications of ToF MS in biomedical and drug discovery research, food safety, and environmental surveillance due to its advantage of intact molecules with a wide range of molecular weights.
With superior noise performance and sampling rate 3X to 6X faster than the ADCs in the current generation of ToF MS instruments, the low-noise, high-speed ADC is a critical part of next-generation, high-performance ToF MS instruments. The high sampling rate makes it possible to reduce the footprint of ToF MS instruments without sacrificing performance because it can reduce the length of the flight tube and hence the burden of the vacuum system. A smaller footprint is important for point-of-care applications and various field applications of ToF MS.
Our bench test of the AD9082 had some limitations, including limited availability of external attenuators for creating test cases with low amplitude input (such as 1% FS, or 40-dB attenuation), impedance mismatch causing reflection in the data, and open space without shielding of electromagnetic interference. The reported SNR of the test cases was lower than its actual value because reflection in the baseline caused by impedance mismatch wasn’t removed in the noise calculation.
MxFE evaluation boards along with graphical-user-interface (GUI) software are available for more intensive test. Detailed instructions aided by live demonstration can facilitate setting up the customer evaluation system. Prototyping with MxFE samples is easy with guidance from an experienced application team.
The measured FWHM and SNR demonstrate superior time accuracy and noise performance of the MxFE ADCs. The up-to-10-Gsample/s rate of the MxFE gives the flexibility to design next-generation ToF MS with better mass accuracy and mass resolution, higher sensitivity, and an even smaller footprint. In addition, MxFE ADCs are backed by power, clocking, and driver products to help ensure seamless systems integration and optimization.
References
1. Jurgen H. Gross. Mass Spectrometry: A Textbook, 3rd Edition. Springer, 2017.
2. Eva Torres-Sangiao, Cristina Leal Rodriguez, and Carlos Garcia-Riestra. “Application and Perspectives of MALDI–TOF Mass Spectrometry in Clinical Microbiology Laboratories.” Microorganisms, Vol. 9, 2021.
3. Mohammad Y. Ashfaq, Dana A. Da’na, and Mohammad A. Al-Ghouti. “Application of MALDI-TOF MS for Identification of Environmental Bacteria: A Review.” Journal of Environmental Management, Vol. 305, 2022.
4. E. Chabriere, H. Bassène, M. Drancourt, and C. Sokhna. “MALDI-TOF MS and Point of Care Are Disruptive Diagnostic Tools in Africa.” New Microbe and New Infections, Vol. 26, 2018.
5. Chun C. Lee. Dissertation: Improving Accuracy and Energy Efficiency of Pipeline Analog to Digital Converters. The University of Michigan, 2010.
